APPENDIX
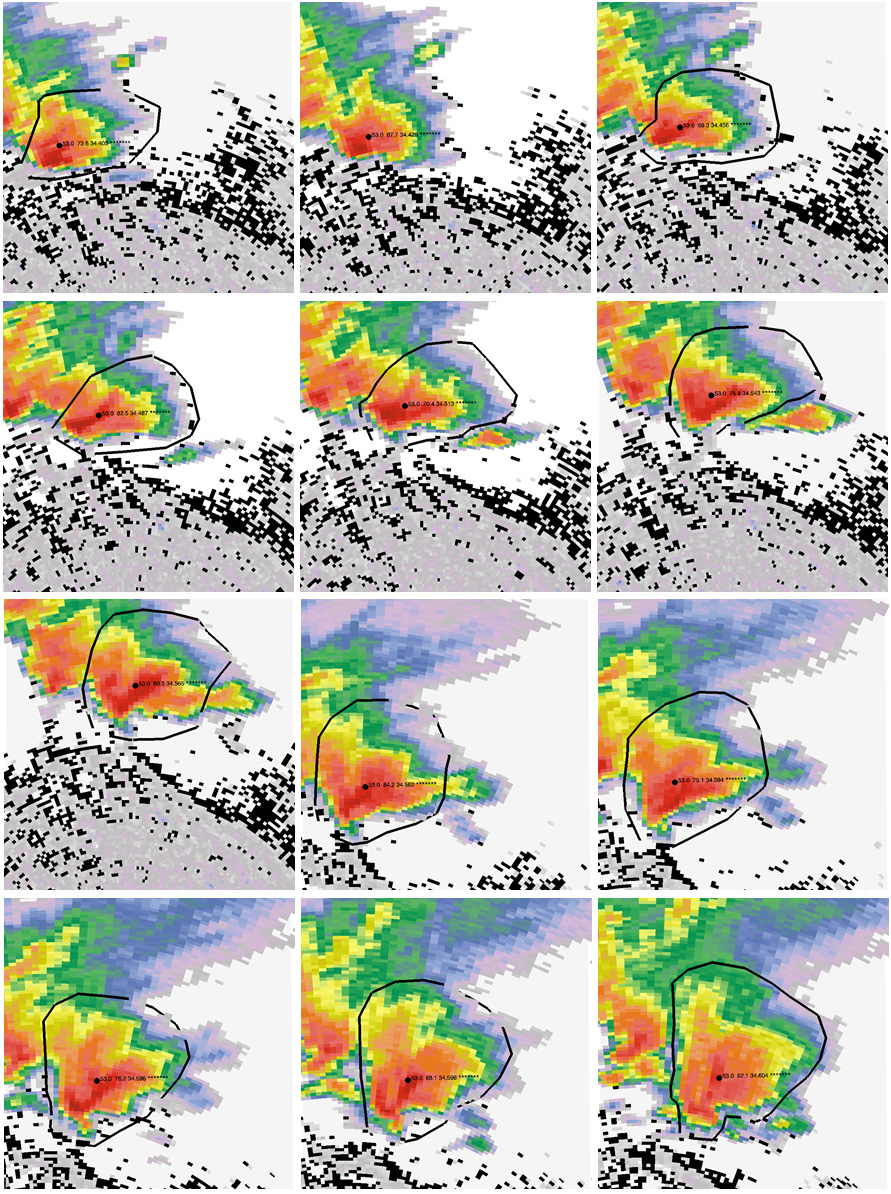
Appendix contains images of radar reflectivity, annotated with the boundary used to control the automated computation of the echo centroid, which is denoted with a black dot. The label next to the black dot contains information used by the analyst for record-keeping and is not of relevance to this paper. The purpose of the appendix is to allow others attempting to repeat this work to make sure that the same storms are being analyzed.
Figure A1. Reflectivity analysis plots for the Plainview storm on 25 May 1994 from the KLBB WSR-88D radar. Rain rate centroids are depicted with a dot and are labeled from left to right identifying the maximum reflectivity, average reflectivity, latitude, and longitude at the map height of 2.16 km. References to panels in the text refer to panels counted from left to right and then top to bottom.
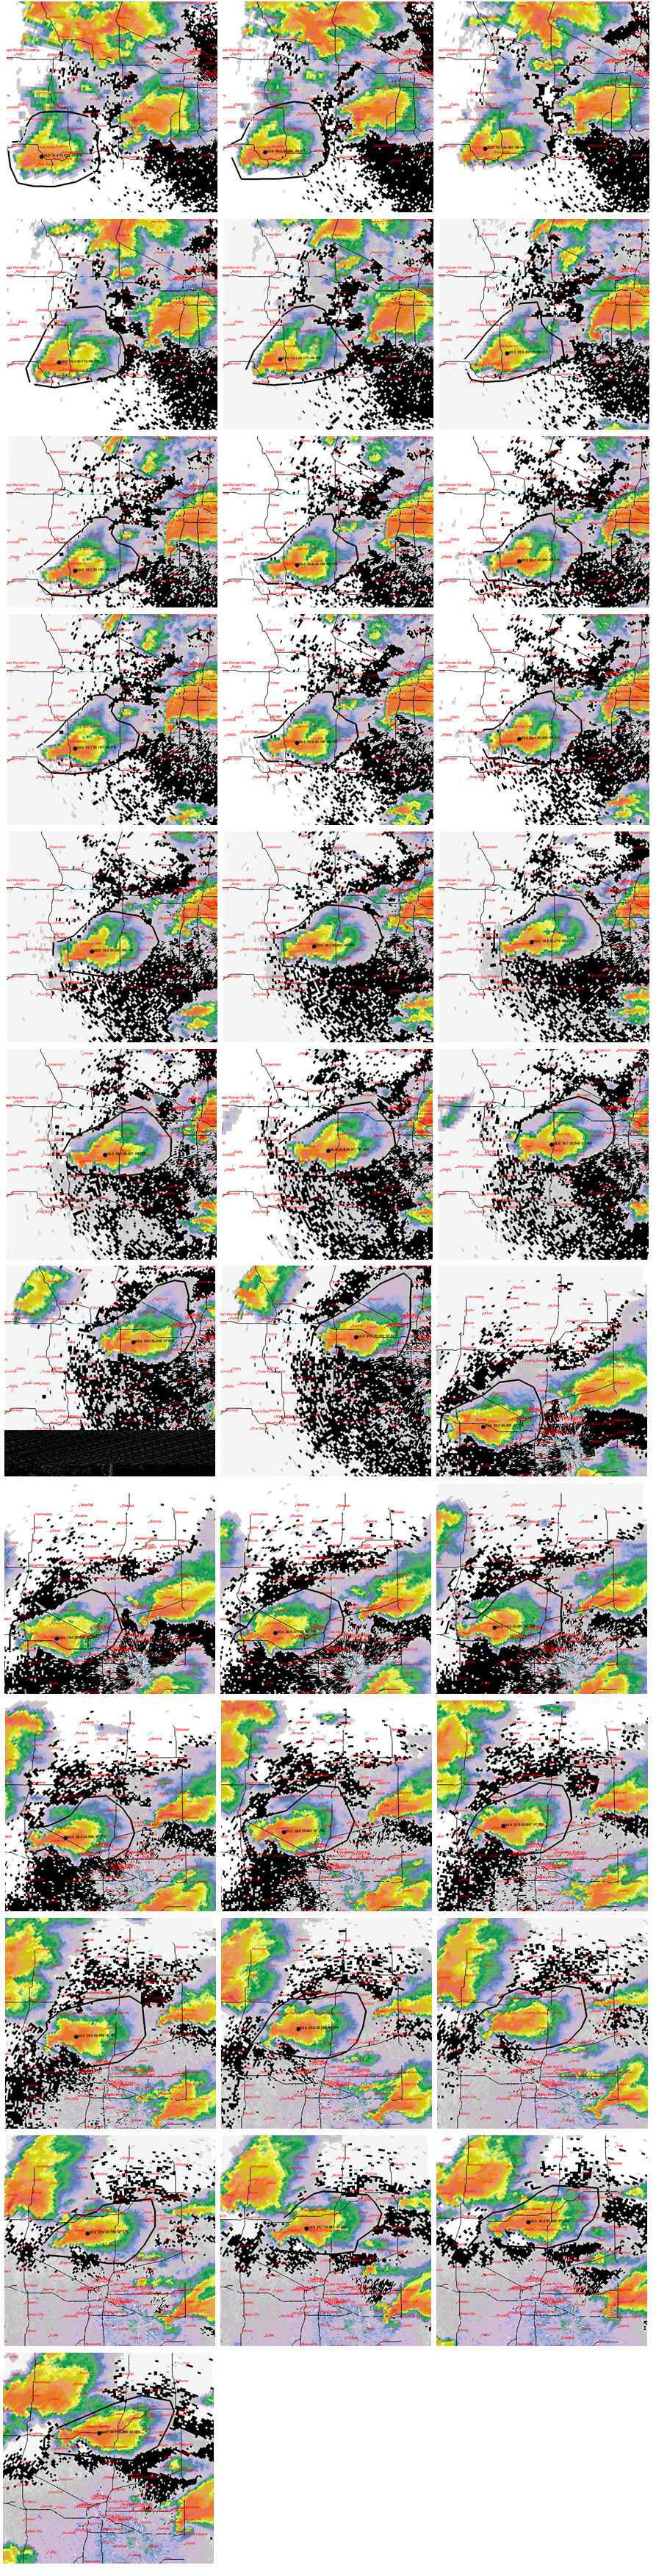
Figure A2. As in Fig. A1 but for storm B, 3 May 1999 viewed from KTLX between 2337 and 0107 UTC, for panels 1-12, respectively. Map height is 1.535 km AGL.

Figure A3. As in Fig. A1 but for storm A, 13 June 1998, viewed from KTLX between 2209 and 2351 UTC, for panels 1-12, respectively. Map height is 1.535 km AGL.
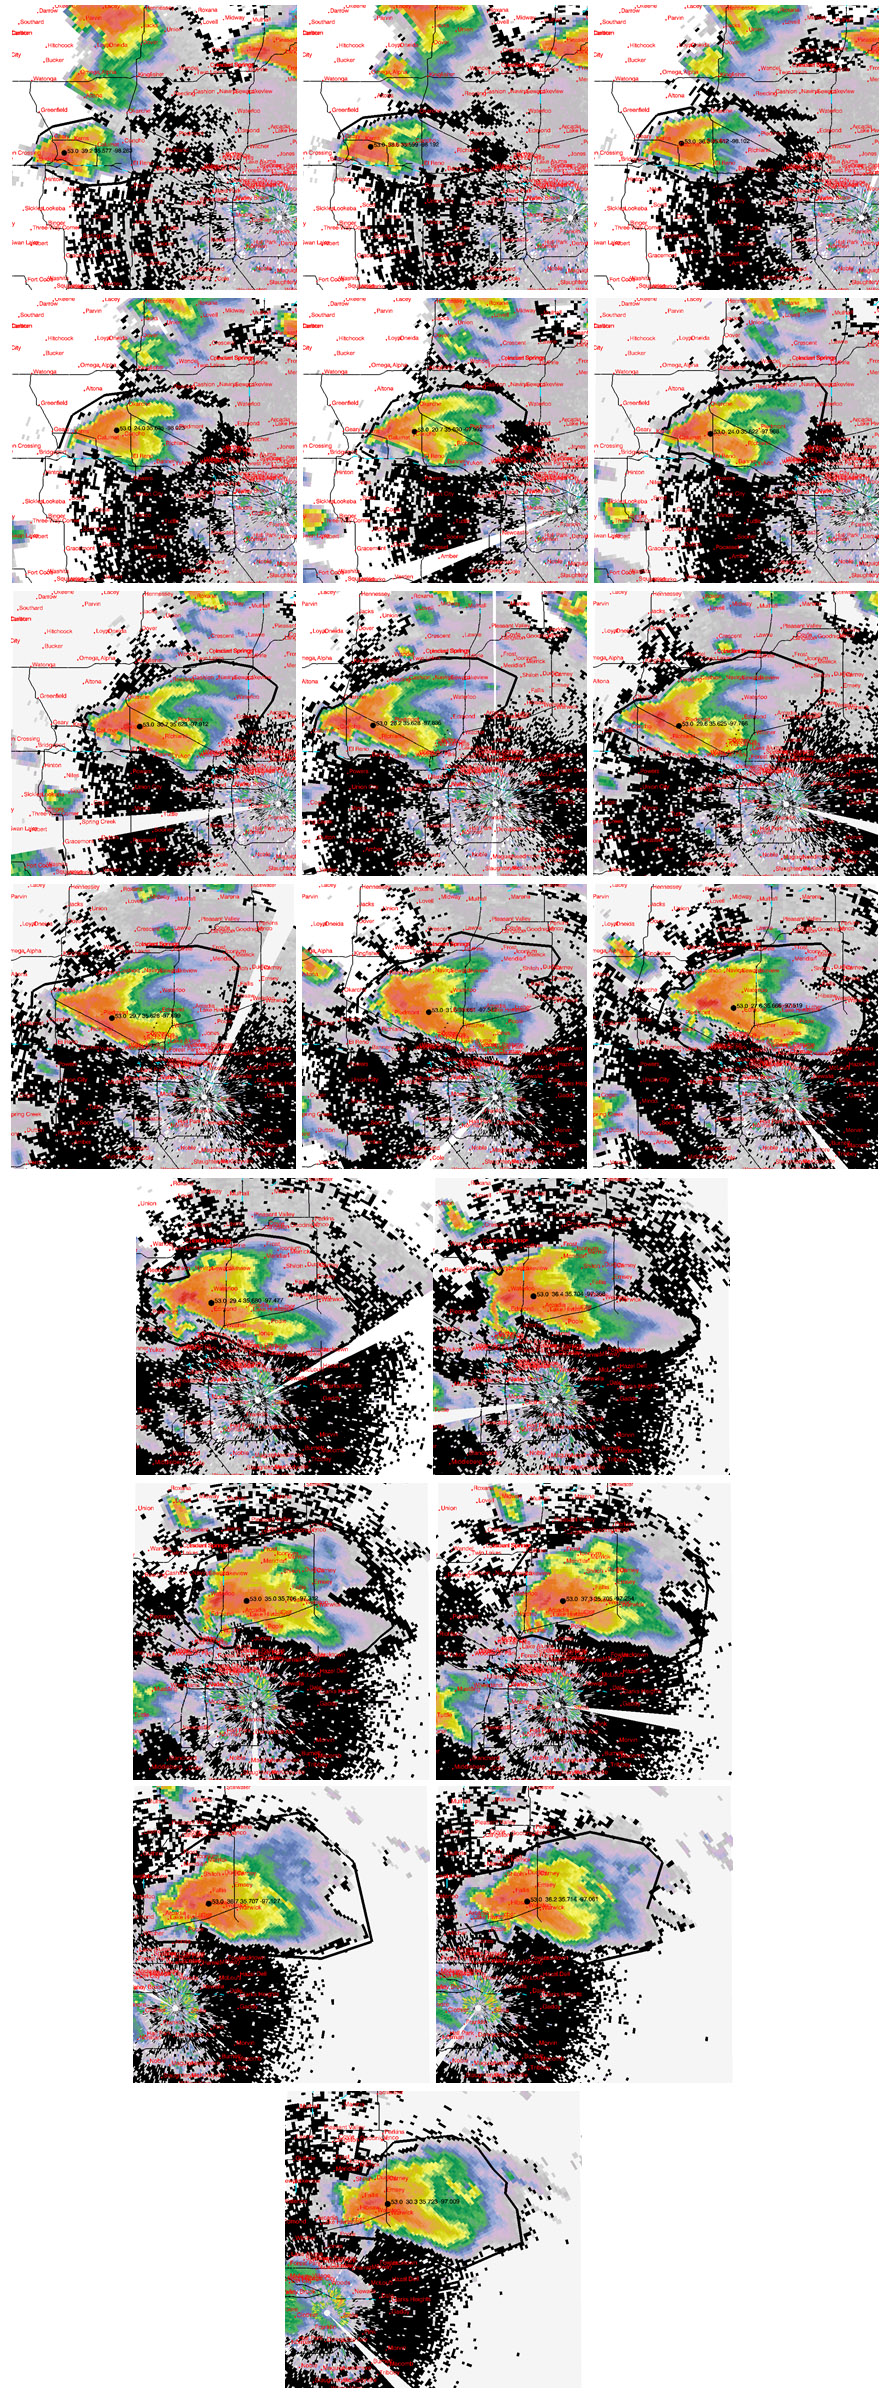
Figure A4. As in Fig. A1 but for storm B, 13 June 1998, viewed from KTLX between 2345 and 0148 UTC, for panels 1-12, respectively. Map height is 1.535 km AGL.
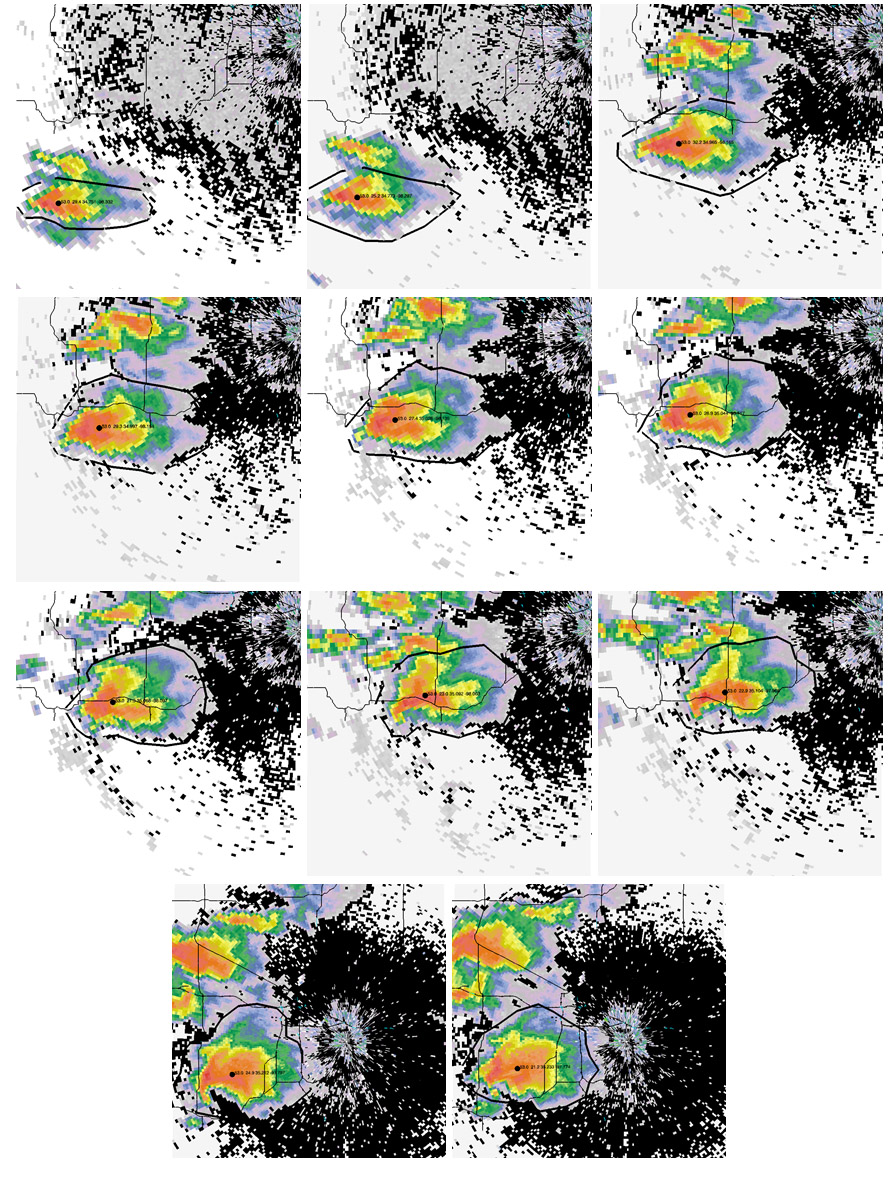
Figure A5. As in Fig. A1, but for storm A, 3 May 1999, viewed from KTLX between 2139 and 2327 UTC, for panels 1-11, respectively. Map height is 1.535 km AGL.

Figure A6. As in Fig. A1, but for the storm north of Lubbock, TX, on 25 May 1999, viewed from KLBB between 2156 and 2251 UTC for panels 1-11, respectively. Map height is 2.163 km AGL.
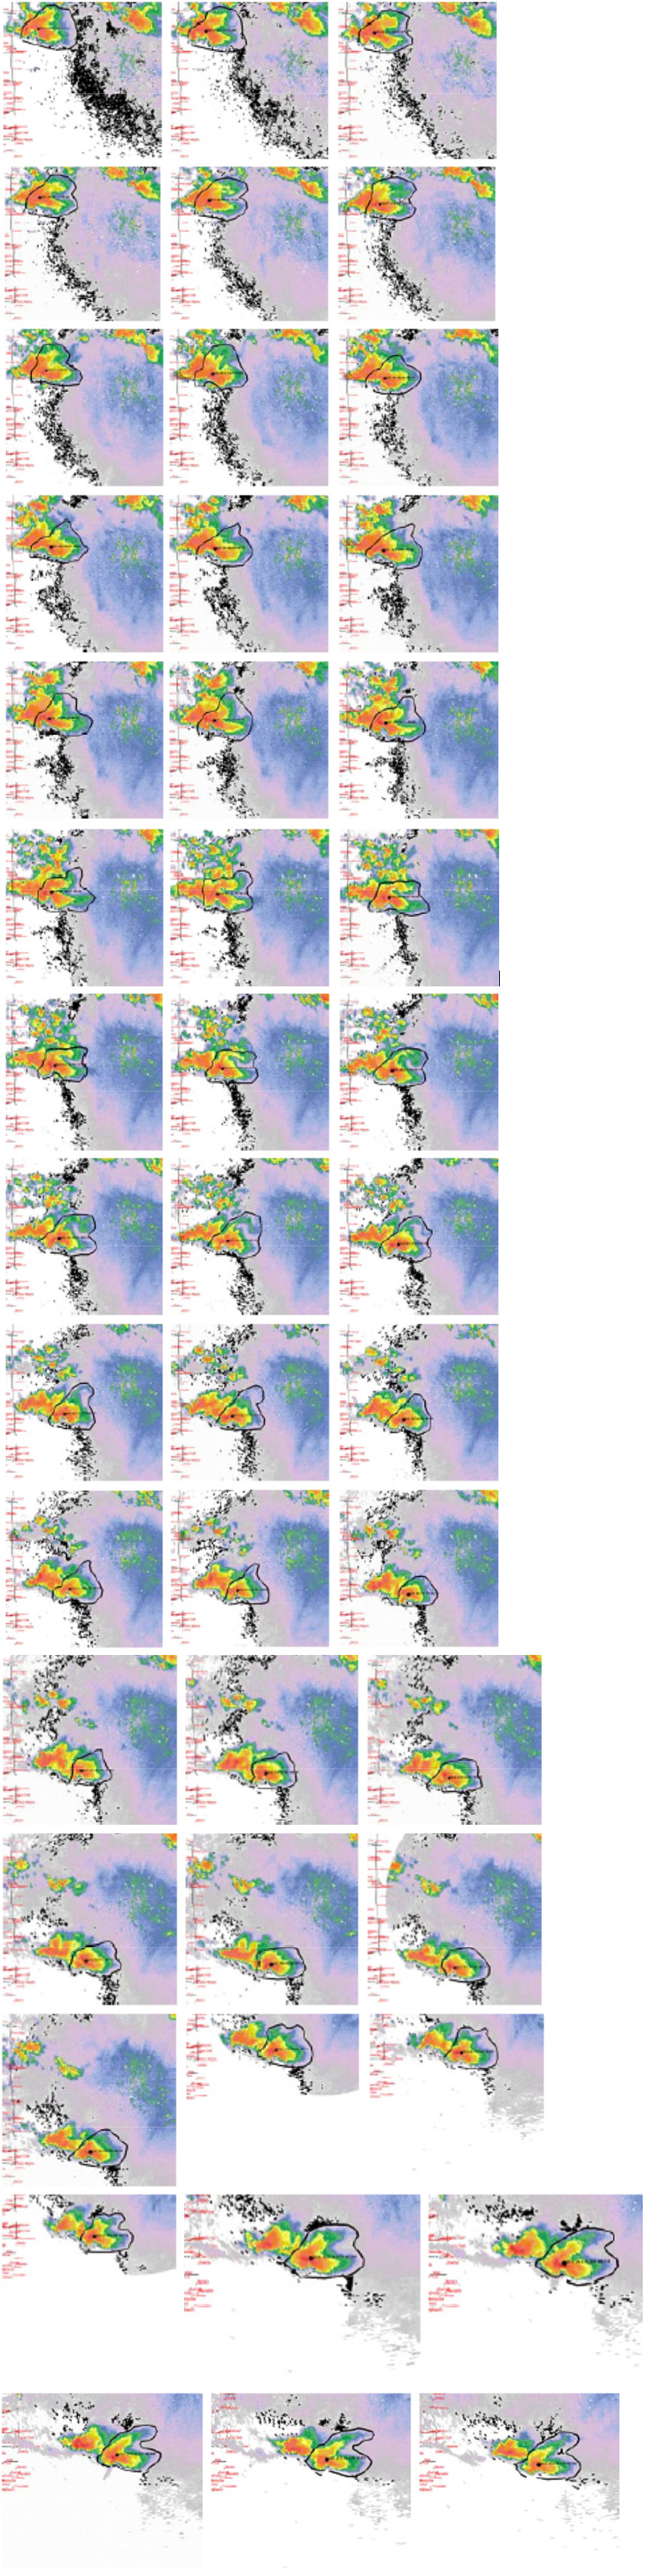
Figure A7. As in Fig. A1 but for Kaw Reservoir, OK, 7 May 1994, viewed from KINX between 0129 and 0329 UTC, for panels 1-45, respectively. Map height is 1.373 km AGL.